Muskoka Watershed Report Card

The Muskoka Watershed Report Card, produced every five years by the Muskoka Watershed Council, scientifically assesses Muskoka’s watershed health. It educates residents and decision-makers about water and land conditions, enabling sustainable practices to bolster the strength of our remarkable natural environment. This is essential for our way of life and economy.
Muskoka Watershed Report Cards have been released in 2004, 2007, 2010, 2014, 2018 and 2023.
Contact us to book a presentation on the Muskoka Watershed Report Card for your group or organization.
2023 Muskoka Watershed Report Card

Muskoka’s watersheds stand at a crucial turning point. While currently healthy, they are gradually degrading in several ways, and our existing management systems seem incapable of halting or reversing this negative trend. We need an integrated, watershed-scale management system capable of dealing with the multiple stresses our iconic environment now faces.
What is Watershed Health?
A watershed is a living and intricate ecosystem capable of maintaining its structure and functions unless faced with excessive stresses. Its health, or ecological integrity, signifies how effectively it preserves its typical structure and functions. Similar to how medical experts gauge human health, we measure watershed health by analyzing diverse indicators.
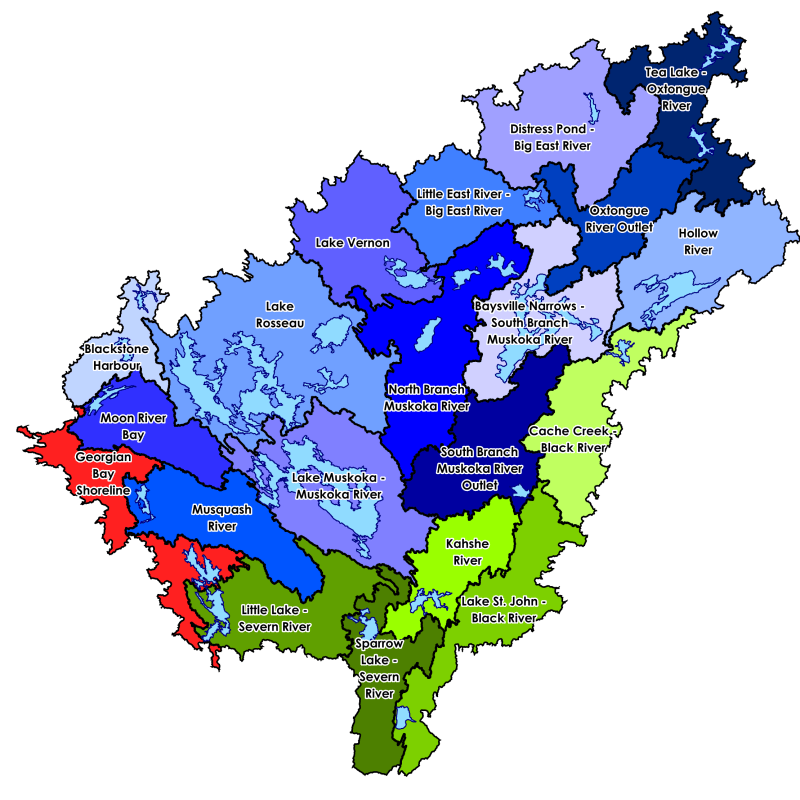
Muskoka’s Watersheds
This Report Card covers the entire Muskoka River Watershed (in blue), as well as a small portion of the South Georgian Bay Shoreline (in red) and parts of the Severn River-Lake Simcoe Watershed (in green) that intersect with the District of Muskoka. This vast 7,000 km2 area spans over 210 km from the Algonquin Highlands to Georgian Bay, including approximately 2,000 lakes amid extensive forests.
Report Card Highlights
Background Report
Or skip to a specific chapter:
Introduction
Chapter 1 – Calcium Concentrations in Muskoka’s Lakes
Chapter 2 – Phosphorus Concentrations in Lakes
Chapter 3 – Benthic Macroinvertebrates in Muskoka
Chapter 4 – Chloride
Chapter 5 – Fish Populations in our Lakes
Chapter 6 – Hazardous Algal Blooms

Chapter 7 – Interior Forests
Chapter 8 – Fragmentation
Chapter 9 – How are Muskoka’s Avian Species Changing?

Chapter 10 – Invasive Species
Chapter 11 – Beech Bark Disease
Chapter 12 – Species at Risk in Muskoka

Chapter 13 – Weather and Climate
Chapter 14 – Ecosystem Integrity and Measuring Watershed Health
References and Acknowledgements
Learn More: The State of our Watershed Series
- The state of our environment: MWC responds to the challenge.
- Valuable wetlands in Muskoka deserve our care
- How healthy are our forests in Muskoka?
- Muskoka’s iconic lake trout need help in face of warmer water, new species in area lakes
- Will loons still call across Muskoka in 30 years?
- Is biodiversity declining in Muskoka?
- What are the bugs in the mud of Muskoka area lakes telling us?
- Phosphorus can be cleaned up from Muskoka’s lakes
- Less ice cover in Muskoka impacts winter sports and could mean ‘more dried up wetlands and streams’
- Harmful algal blooms: What is the cause and what can Muskoka residents do?
2018 Muskoka Watershed Report Card
The 2018 Muskoka Watershed Report Card was released in July 2018 and provides a science-based evaluation of the health of our watershed using a variety of environmental ‘health’ and ‘threat’ indicators that provide a “snapshot” of watershed health and increase our understanding of the watershed where we live, work, and play.
There are many new features incorporated into the 2018 Muskoka Watershed Report Card, including a strong online interactive multimedia component and interesting, easy to understand infographics.
Learn more by exploring the tabs below!
- Summary
- Background Report
- Story Maps
- Subwatershed Infographics
Dive deeper into the 2018 Muskoka Watershed Report Card with the online interactive multimedia story maps!
2018 Muskoka Watershed Report Card
Health Indicator: Phosphorus Concentrations in Lakes
Health Indicator: Calcium Concentrations in Lakes
Health Indicator: Benthic Macroinvertebrates
Health Indicator: Interior Forest
Threat Indicator: Climate Change
Threat Indicator: Invasive Species
Threat Indicator: Fragmentation
Threat Indicator: Species at Risk
 Big East River Watershed
 Dee River Watershed
 Gibson River Watershed
 Hollow River Watershed
 Kahshe River Watershed
 Lake of Bays Watershed
 Little East Watershed
 Lower Black Watershed
 Mary Lake Watershed
 Moon River Watershed
 Lake Muskoka Watershed
 North Muskoka River Watershed
 Oxtongue River Watershed
 Lake Rosseau Watershed
 Rosseau River Watershed
 Severn River Watershed
 Skeleton River Watershed
 South Muskoka River Watershed
 Upper Black River Watershed
2014 Muskoka Watershed Report Card
- Summary
- Background Report
- Subwatershed Report Cards
 Big East River Subwatershed Report
 Dee River
Subwatershed Report Gibson River
Subwatershed Report Hollow River
Subwatershed Report Kahshe River
Subwatershed Report Lake of Bays
Subwatershed Report Little East River
Subwatershed Report Lower Black River
Subwatershed Report Mary Lake
Subwatershed Report Moon River
Subwatershed Report Lake Muskoka
Subwatershed Report North Muskoka River Subwatershed Report
 Oxtongue River
Subwatershed Report Lake Rosseau
Subwatershed Report Rosseau River
Subwatershed Report Severn River Subwatershed Report
 Skeleton River
Subwatershed Report South Muskoka River
Subwatershed Report Upper Black River
Subwatershed Report
2010 Muskoka Watershed Report Card

- Summary
- Background Report
2009 Progress Report Card
The principal objective of the 2007 Watershed Report Card was to evaluate changes in ecosystem condition and the impact of human actions against a standard of a healthy, functioning and sustainable watershed. Achieving this objective is a shared responsibility of everyone who lives within the watershed.
The 2009 Progress Report Card explored new programs and actions that have been taken by municipalities to move toward the long-term goal of sustainability. Although municipal action is only one component of the overall equation, there is no doubt that our municipal governments can, and do, take a lead role by their example and by implementing policies and regulations that support a more sustainable approach to development and community activities.
2007 Muskoka Watershed Report Card
The 2007 Watershed Report Card was released on July 27, 2007 at Partners Hall in the Algonquin Theatre in Huntsville.
The objective of the 2007 Watershed Report Card was to evaluate changes in ecosystem condition and the impact of human actions against a standard of a healthy functioning ecosystem. A review of existing data on the health of our water, air and land forms the basis upon which the 2007 Watershed Report Card was developed.
- Summary
- Background Report
2004 Muskoka Watershed Report Card
MWC released its first Report Card of Watershed Health on Thursday, July 8, 2004 at Annie Williams Park in Bracebridge.
MWC worked closely with several provincial and federal departments to accumulate and analyze environmental data for Muskoka and were pleased with the results of the 2004 Report Card. It was used to guide MWC’s projects and programs for the follow several years.
- Summary
- Background Reports